


Guidelines For Efficient Scientific Illustrations: Everything You Need To Know
As a scientist, drafting reports and research articles are the main duties. Researchers and academics all around the world spend a major part of their time performing studies or writing papers and records. Nonetheless, there is a particular facet of articles and reports that some never give much attention and that is biological illustrations. Report and articles are written to spread ideas to a large group of audiences like the public, fellow scientists, and academics. All individuals who have gone through the article or report finds that infographics, graphs, figures, and illustrations are an indispensable element in depicting conception in a clear manner. Heretofore, there were not many efficient technical aids that can effortlessly create interesting and clear scientific illustrations. However, with the revolutionization of the digital world, this is transforming.
For academic researchers, the findings can only become valuable when they get published. The generation of scientific figures and images corresponding to the research is the major section of the publishing process. Usually, all kinds of academic journals have provided few criteria for figures and images to be accepted. Image properties like layout, file type, font style and size , resolution, and image size are the commonly checked aspects in style standards.
The complete procedure for the generation of figures or images for a paper is mostly a daunting and extremely time-consuming task, especially for budding researchers. With the advent and expansion of online publications & submissions, the process can now move swiftly and facilely. As a matter of fact, there are numerous software tools that benefit both image creation and data retrieval. This article will delineate how one can make explicit and useful figures to clearly convey their concepts and research with certain guidelines for efficient scientific illustrations. In addition to that, this write-up will explore current tools for researchers and scientists to create such infographics.
Significance Of A Good Scientific Image
Review and research article journals have stringent rules for image quality. Personnel and editors of these journals will reject the paper before review if the figures are of poor standards. Moreover, bad image quality can mark a wrong impression among reviewers and readers. Therefore, during creating and editing biological images, make sure to apply drawing or scientific illustration tools to transform the concepts into a loud and clear one.
Tables can effectively convey data more rapidly and this method is quite easy for those who want to save time. Because of this, if one has a properly-designed table, the manuscript can have a better impact. Thus, tables must have clearly described units for each and every data entry, aligned data entries within each cell, well-defined headings, descriptive and clear titles.
How Start With Scientific Illustration?
The first and foremost thing is to undergo a thorough study on the subject. Prior to the drawing process, one must be proficient in the area of interest. Suppose you are demonstrating a particular organ or a process, dividing it into small chunks can help you come up with a great way to illustrate it. After getting all the details required, prepare few rough drawings, which is like laying an article outline. One needs to have a clear picture of what they want their drawing to look like prior to working with scientific illustration techniques.
During rough sketching, it is crucial to concentrate on ingraining the minds of the audience. Finding out the target audience will clearly let one know what all details must be integrated and which all to be omitted.
At last, before using these image tools, keep in mind that the aim of a scientific illustration is not to present foreign and unknown things. There are employed to demonstrate the details in the paper in a manner that is simpler to discern for the readers. For instance, if the write-up is about the mechanism of a stent opening up obstructed arteries inside a heart then make an image depicting the main elements and pointing out the role of the stent.
Scientific Illustration Tools
The most commonly used tools are Adobe Photoshop & Illustrator, and PowerPoint. Even though PowerPoint is an ideal tool for creating slideshows, it is difficult to make a proper image with this. Adobe Photoshop & Illustrator are great tools, however, they are hard to learn and are costly as well. Luckily, new illustration tools have been devised lately with specific capabilities and features for researchers. Choosing one relies on the desired outcomes, budget, and computer literacy of the researcher. Here are few good tools which can be adopted for efficient scientific illustrations.
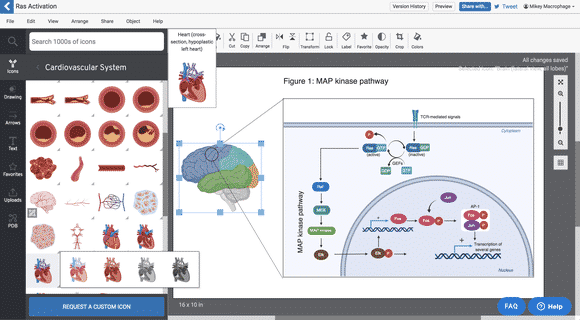
The current trendy tool is BioRender, which was formed by a group of women from Toronto who identified the demand for a simple drawing tool for researchers. It has a collection of over 30,000 life-science icons including pictures and anatomical drawings of everything ranging from fruit flies to SARS-CoV-2 viruses. This tool facilitates one to simply drag and drop icons & even has unique illustration aids. But, it has an institutional charging of USD $99 for 5 people or USD $35 per month.
ImageJ is a freely accessible program made by the National Institutes of Health and offers extensibility through recordable macros and Java plugins. It allows users to alter, assess, process, save & print 32-bit floating-point, 16-bit integer, and 8-bit grayscale and color images. It can also work with several file formats as well as supports stacking of images, which is particularly useful for live-cell imaging. It can even be applied for calculating the pixel value statistics and area of intensity-threshold objects and user-defined selections. It quantitated angles and distances and can be utilized to prepare line profile plots and density histograms. It fundamentally facilitates image preparation and analysis and enables easy importing during saving to other tools for more processing.
PowerPoint is a program by Microsoft Office with the provision to improvise figures and images with parameters like altering contrast and brightness, resizing, aligning, text addition, cropping. Several scientists consider it as a standard tool for making figures and images as they gather data since this format is frequently employed for presentation uses. Figures and images generated with this tool can be saved as a separate file type to be downloaded for use in other software.
Adobe Photoshop is regarded as the most strong image editing tool available. It must be utilized attentively during editing for scientific journal publications as it has various factors that are used for improving images which is easy to unintentionally violate the image editing standards given by the publishers. Color, resolution, and image size can be modified. Also, alterations can be done with contrast, brightness, curves, and levels features. The best attribute of this tool is that many figures can be merged together to make images for publication using masking and layers methodologies. Although a small assimilation time is required for tackling this tool, once the basics are completed, it is an extremely robust aid for scientists.
Adobe Illustrator is also a widely used image manipulating tool. This vector-based illustration software enables aligning several figures, creating images, and importing pictures. High-resolution image exporting is possible once the image is created. This tool facilitates complete tailoring and image enhancement. This software also has a big toolbox with numerous aspects that can be employed to make relevant standard figures and images.
R is an open graphic development and statistical computing software. It operated on different operating systems. Additionally, a set of default options are available to make publication-level pictures easily. Despite being free, it is less user-friendly.
Cytoscape is a freely accessible program that assists integration, analysis, and visualization of data. This tool also is not user-friendly.
ImageMagick is an image editing software that is utilized for reading and writing images in formats such as PDF, TIFFm FIG, JPEG, PNG, and so on. Because of this, it can easily alter images, This tool enables users to delineate features of images, draw, decorate, manage color, animate and composite images. Also, this tool can be used with several coding forms.
EDrawSoft provides professional templates and scientific pictures. It is also good for life science-related studies.
Gimp is yet another favored tool that can be merged with plugins for high-quality picture editing. It is a free platform and is a bit difficult for beginners. It needs far more computer literacy compared to other illustration software.
InkScape is also a popular and open-source program for researchers intending to tailor vector graphics. It has flexible illustration tools with extensive file format compatibility and a robust text tool.
Cacoo is a wonderful tool for combining as it can create pictures along with editing and commenting in real-time.
Tips For Efficient Scientific Illustrations
Even though image creation is quite an exhausting task, with proper tools this can be smooth. Many researchers utilize a blend of the few discussed tools to prepare their illustrations. Once the basic knowledge and understanding of the tools are gained, the next thing is to create a good figure. A fair image must depict details explicitly in a striking way. It must boost the reader’s understanding, rather than confusing him/her. Color can be used, however, the entire rainbow of colors need not be used. When color is used sparingly it can pinpoint the most crucial factors of the image. Texts are another aspect to be exploited to benefit observers perceive what they are seeing. Few guidelines for efficient scientific illustrations are mentioned below.
![]() Note to comply with the rules provided by the journal as such. If not, papers would be sent back without reviewing
Note to comply with the rules provided by the journal as such. If not, papers would be sent back without reviewing
![]() Learn about image editing fraud practices in order to not make such mistakes
Learn about image editing fraud practices in order to not make such mistakes
![]() Examine the images for mistakes prior to paper submission. Remember to present the diagrams in a way that coordinates with the content of the manuscript
Examine the images for mistakes prior to paper submission. Remember to present the diagrams in a way that coordinates with the content of the manuscript
![]() It is ideal to take a print out of the images to assure the quality and spot the mistakes before submission
It is ideal to take a print out of the images to assure the quality and spot the mistakes before submission
![]() Always make sure it is in the format needed by the journal
Always make sure it is in the format needed by the journal
![]() Eliminate unwanted and irrelevant section from the pictures
Eliminate unwanted and irrelevant section from the pictures
Concluding Remarks
Learning the necessary concept in creating coherent and information-packed graphical illustrations of projects is vital to scientific advancement, and must be included in the education system for budding researchers. Visualization is a significant part of the current scientific research, enabling all to discern the techniques and processes learned and actively engage a bigger crowd.
Guidelines For Efficient Scientific Illustrations, Guidelines, Efficient Scientific Illustrations
Check Out The Articles By Biotecnika